
Frank Martin
Biomedical Engineer & Software Engineer

Biomedical Engineer & Software Engineer
The BlueBerry project was a two-year initiative to develop a blueprint for a sustainable, scalable, and impactful data infrastructure for rare cancers in Europe. In the context of IKNL, I have been involved in extending the vantage6 software to be able to connect to OMOP data sources.
When the project finished in September 2024, it was decided to continue with the registry to use it for research. However, several challenges needed to be addressed before it could be used for research:
I was asked to work together with BIOMERIS on addressing these issues to enable researchers using the platform for gaining meaningful insights.
In this blog post, I will explain first how I address performance issue as this influences how the user interface is designed. Then, I will explain how the user interface is designed to support the workflow of the researcher.
Typically in vanilla vantage6, the data is fetched from the data source for each computation call. This made computations slow as the OMOP query was typically time consuming. To speed up the computations, I decided to fetch the data once for each cohort and store it local in the vantage6 node.
┌──────────┐   ┌────────────┐   ┌────────────┐
│ OMOP     │   │ Query      │   │ Local DB   │
│ Database ├──►│ Algorithm  ├──►│ Parquet    │
└──────────┘   └────────────┘   └────────────┘
The Query Algorithm is a vantage6 algorithm that is responsible for fetching the data from the OMOP database. It creates the ATLAS cohort and reads the patient features. The data is stored by this algorithm in a Parquet file. This Parquet file is then used by the other algorithms to perform the analytics.
┌────────────┐   ┌────────────┐   ┌───────────┐
│ Local DB   │   │ vantage6   │   │ Algorithm │
│ Parquet    ├──►│ Algorithm  ├──►│ Output    │
└────────────┘   └────────────┘   └───────────┘
Note
In the future, I would like to extend the system so that these Parquet files can also be modified by the user. For example, the user can create new variables.
There are some challenges with this approach:
When a node is offline when a new cohort is created it will not be able to fetch the data. In this case, the node will create the cohort data it comes online. The user can work with the other nodes in the meantime.
Note
An additional benefit of this approach is that algorithms do no longer have the logic to fetch the data from the OMOP database. So the vantage6 community algorithms can be used without (much) modification.
The official vantage6 User Interface (UI) is developed as a general-purpose vantage6 UI.
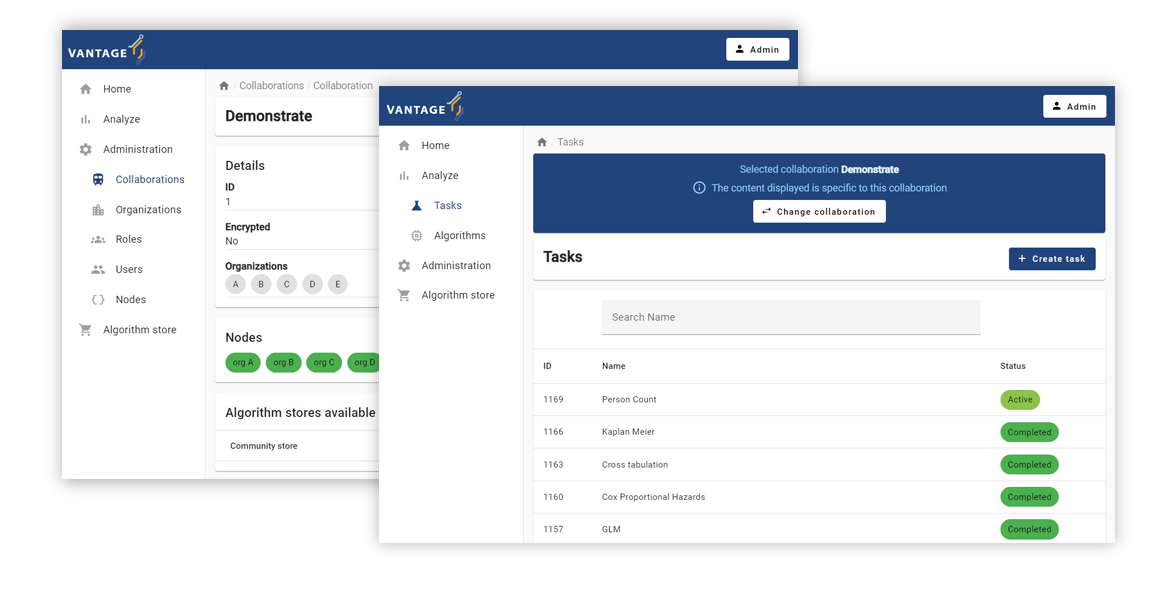
The official vantage6 user interface from vantage6 (from https://vantage6.ai).
If a new feature is to be added in this interface, it needs to be compatible with other projects from the community as well. This has two major disadvantages:
For these two reasons, I decided it would be better to create a separate, dedicated UI for the BlueBerry registry. This way, I can tailor the workflow exactly as it should be and I don't have to consider other projects when adding new features.
Important
As the proposed dedicated UI is aimed to support the workflow of the researcher, it is not going to contain all the features that the official vantage6 UI has. The official vantage6 UI is still available for the BlueBerry registry. It is possible to switch between the two UIs.
For instance, the official vantage6 UI is still used for the management of the collaborations and studies.
To accelerate development, I used Streamlit. This framework brought the following advantages:
However, it introduces an additional backend component, the one that renders the front end. The app's appearance and components can be customized, however the customization is very different from front-end frameworks like React or Angular.
This newly developed UI aims to better support the researcher's workflow. The first thing after logging in is to select the collaboration and optionally the study it wants to work with. Once the collaboration/study is selected, the user can view the online organizations within the collaboration or study. The user is at this point able to create sub selections of the organizations it wants to work with.
| Collaboration & Study Selection | Node status |
|---|---|
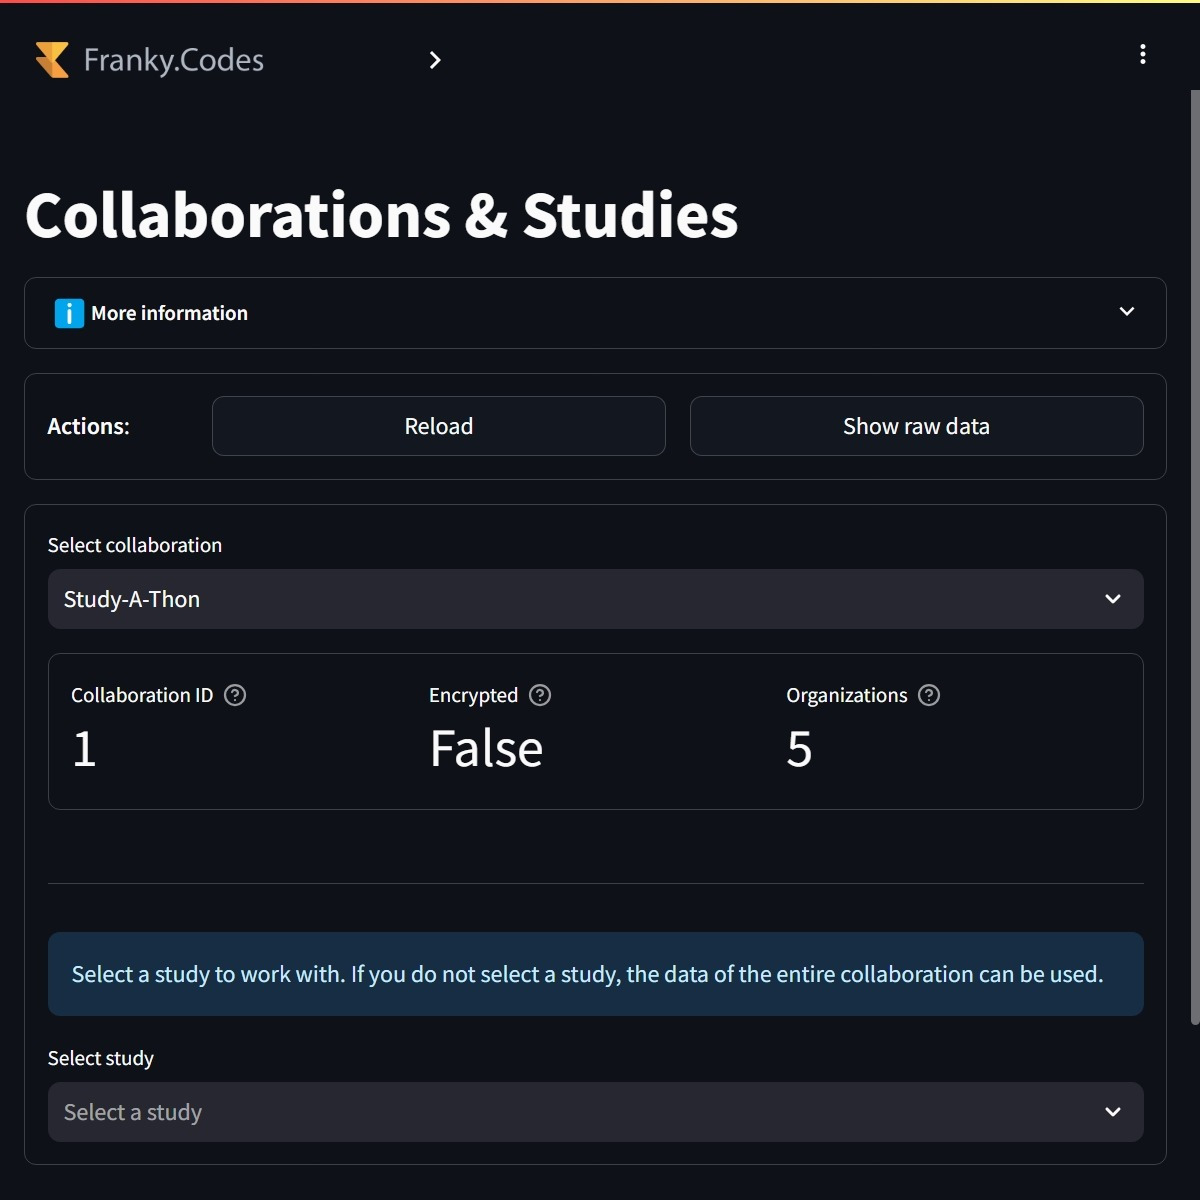
Users first need to select the collaboration and optionally the study they want to work with. Some metadata is shown about the selected collaboration and study. |
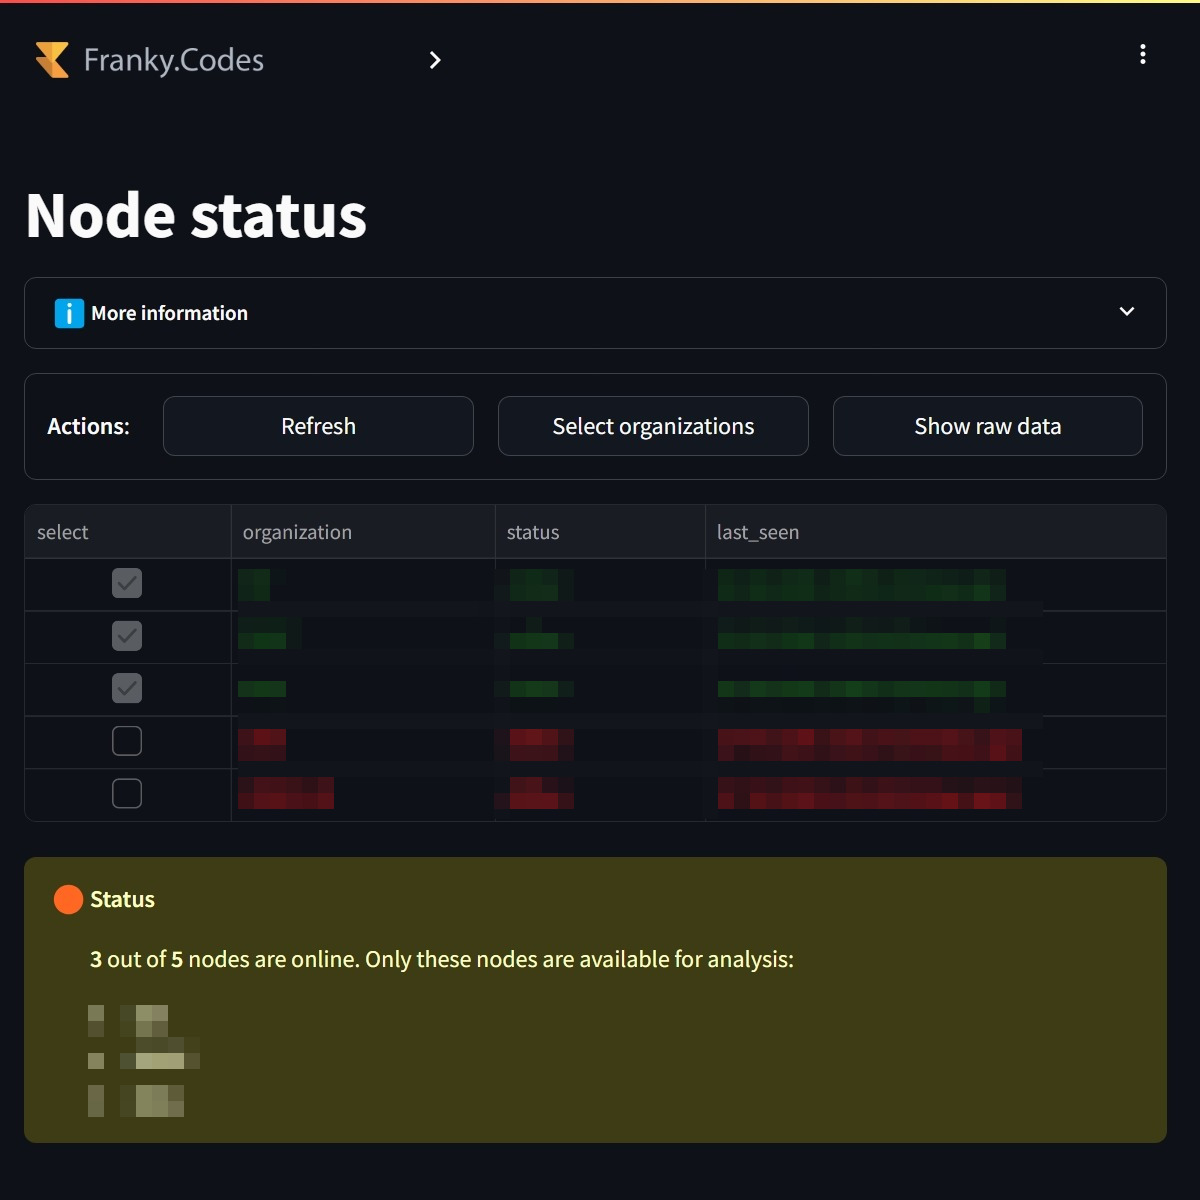
Once the collaboration is selected, the user can view the online organizations. It is possible to create a sub selection of the organizations the user wants to work with. |
Once the organizations are selected, the system checks which cohorts are available for the selected organizations. The UI then determines automatically which cohorts are ready for analysis, it validates that:
By default, all the healthy cohorts are selected. The user can also make a sub selection of the cohorts it wants to work with. It is also possible to create a new cohort based on the ATLAS cohort definitions.
| Cohort selection | Cohort creation |
|---|---|
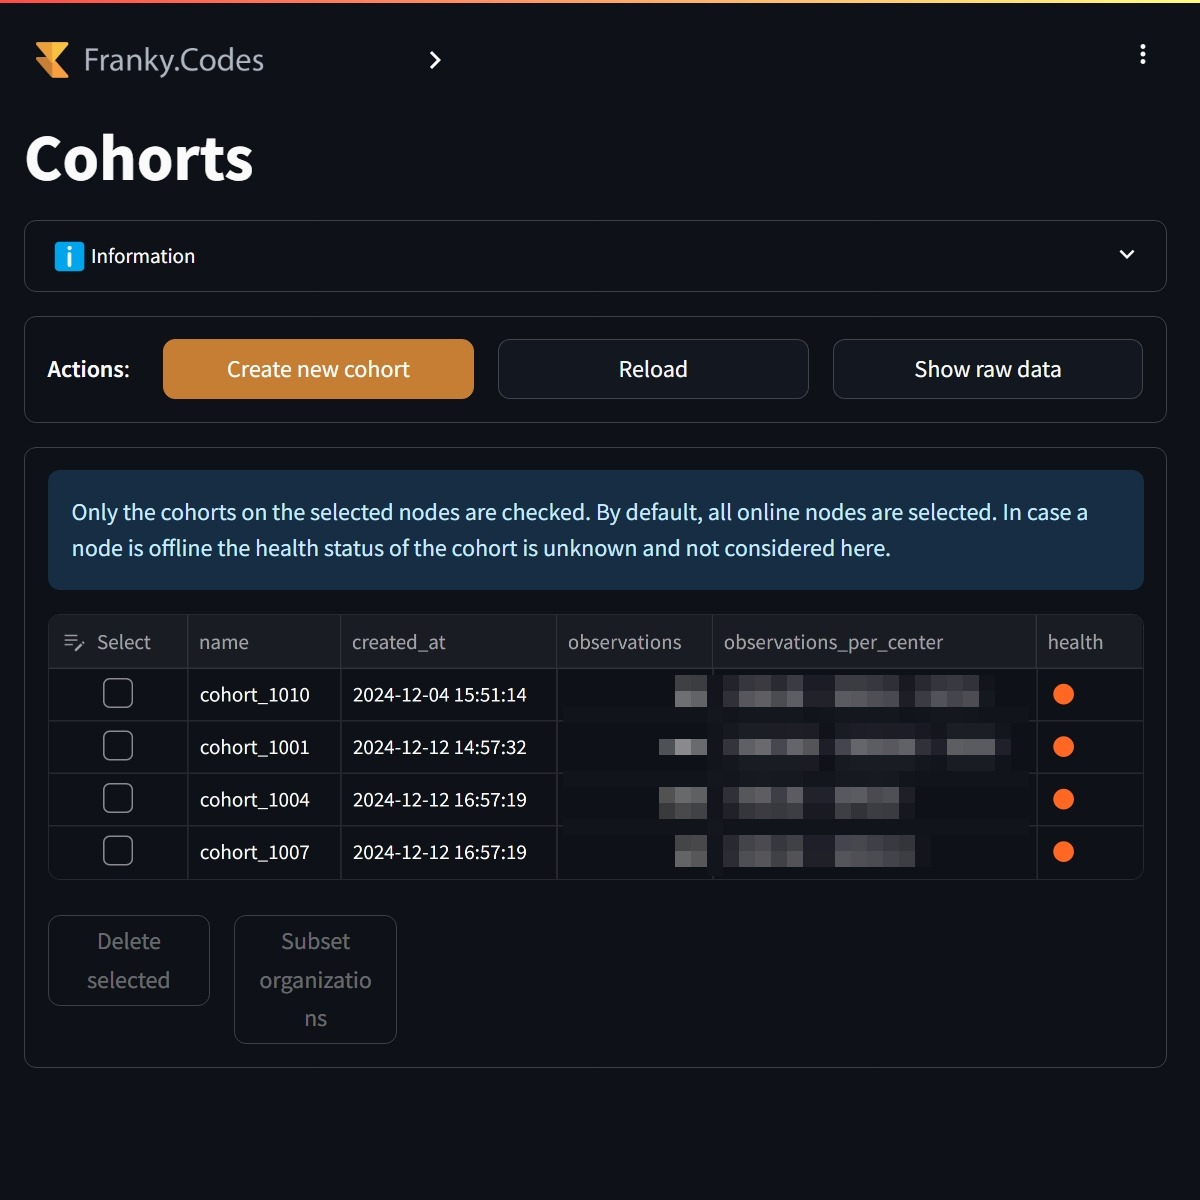
Users can select the cohorts they want to work with. By default, all the healthy cohorts are selected. In this case none of the cohorts are healthy. |
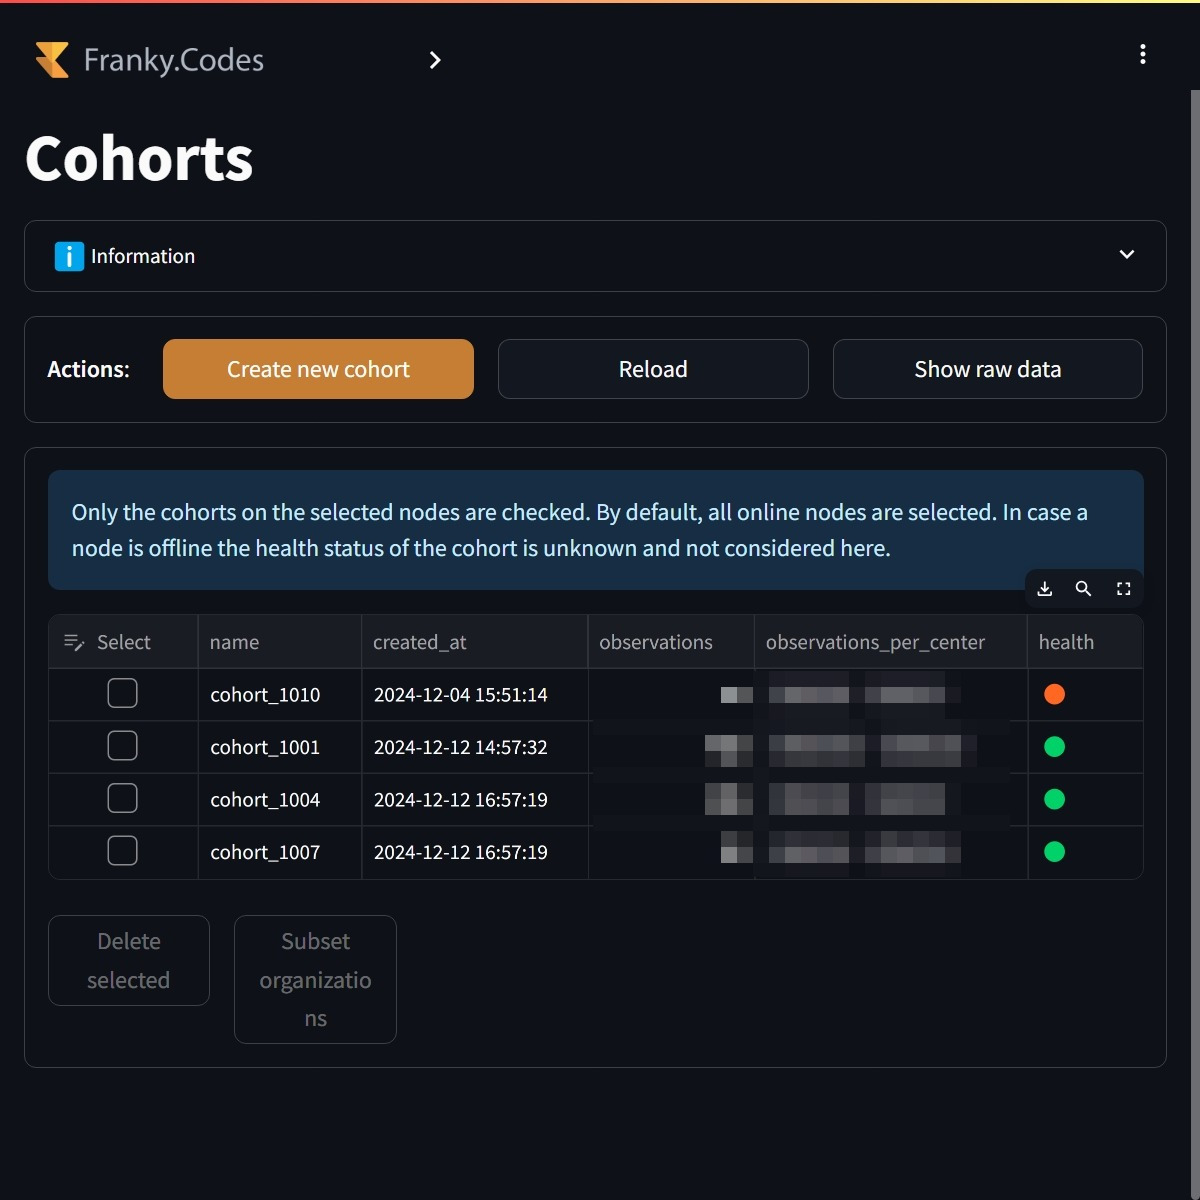
Before the user can continue all the selected organizations need to have the cohort available. The user is able to select the cohorts and from there automatically select the organizations that passed the validation. |
Once the cohorts have been selected the user can continue to the analytics part of the application. The first analytics that is available is the summary statistics. This gives an overview of all selected cohorts and its variables. It reports some basic statistics like missing, mean, standard deviation, etc.
The second analytics that is available is the crosstabulation. This is a useful tool to compare the distribution of two categorical variables. The user can select the variables it wants to compare and the crosstabulation is calculated for all selected cohorts.
The third analytics that is available is the Kaplan-Meier curve. This is can be used to compare the survival between cohorts. The dataset contains the survival time and the event indicator, so these are already preselected.
| Summary statistics | Crosstabulation | Kaplan-Meier curve |
|---|---|---|
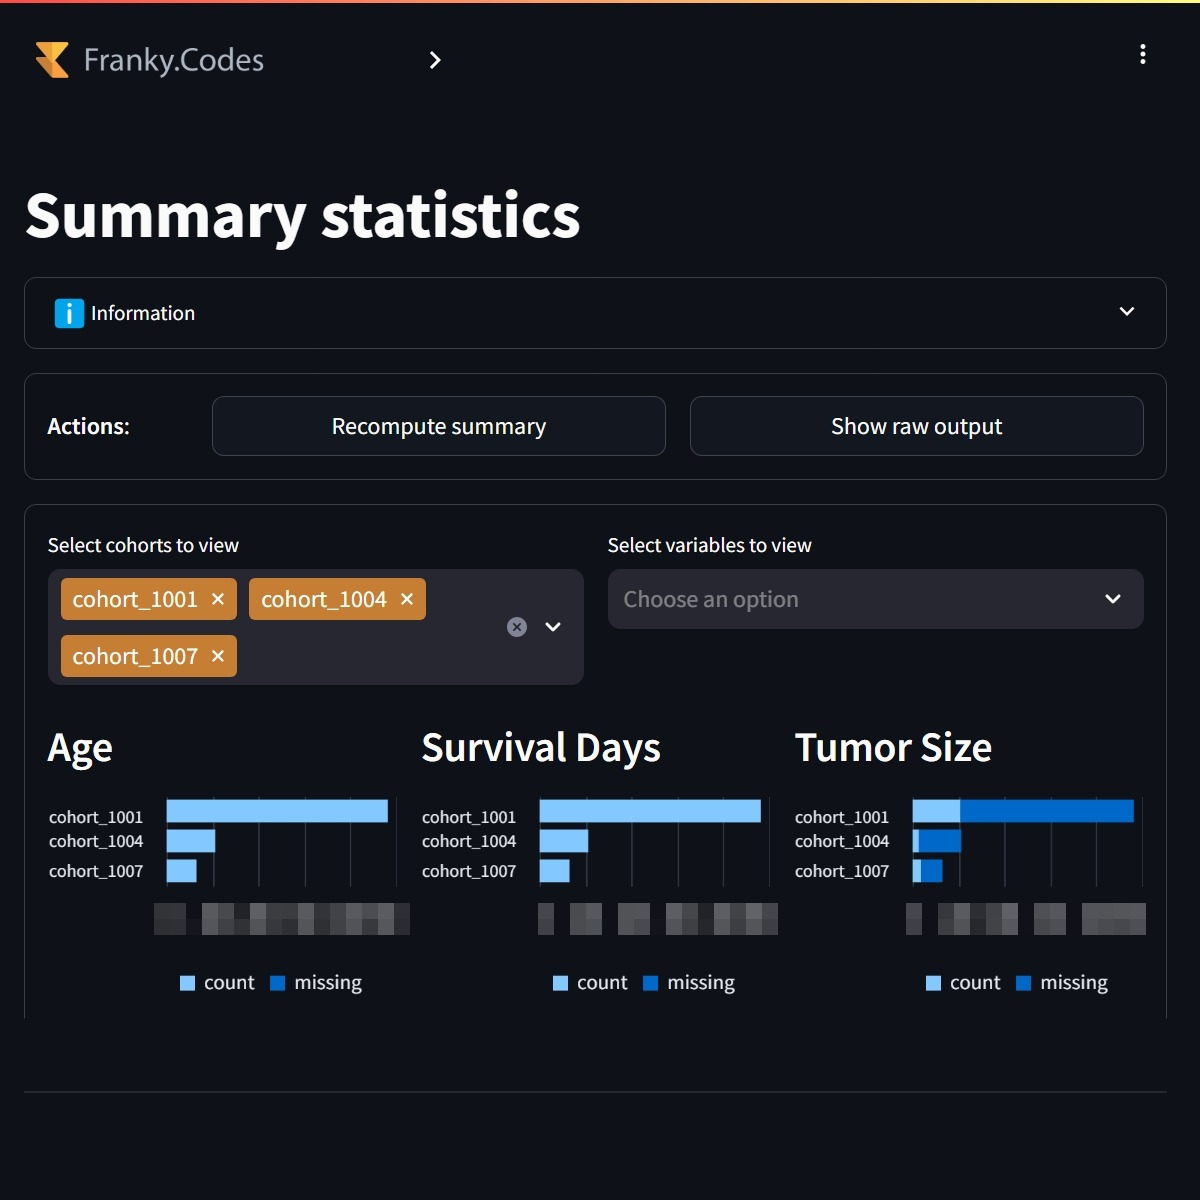
Users can view the summary statistics of all selected cohorts. The summary statistics are calculated for all selected cohorts. |
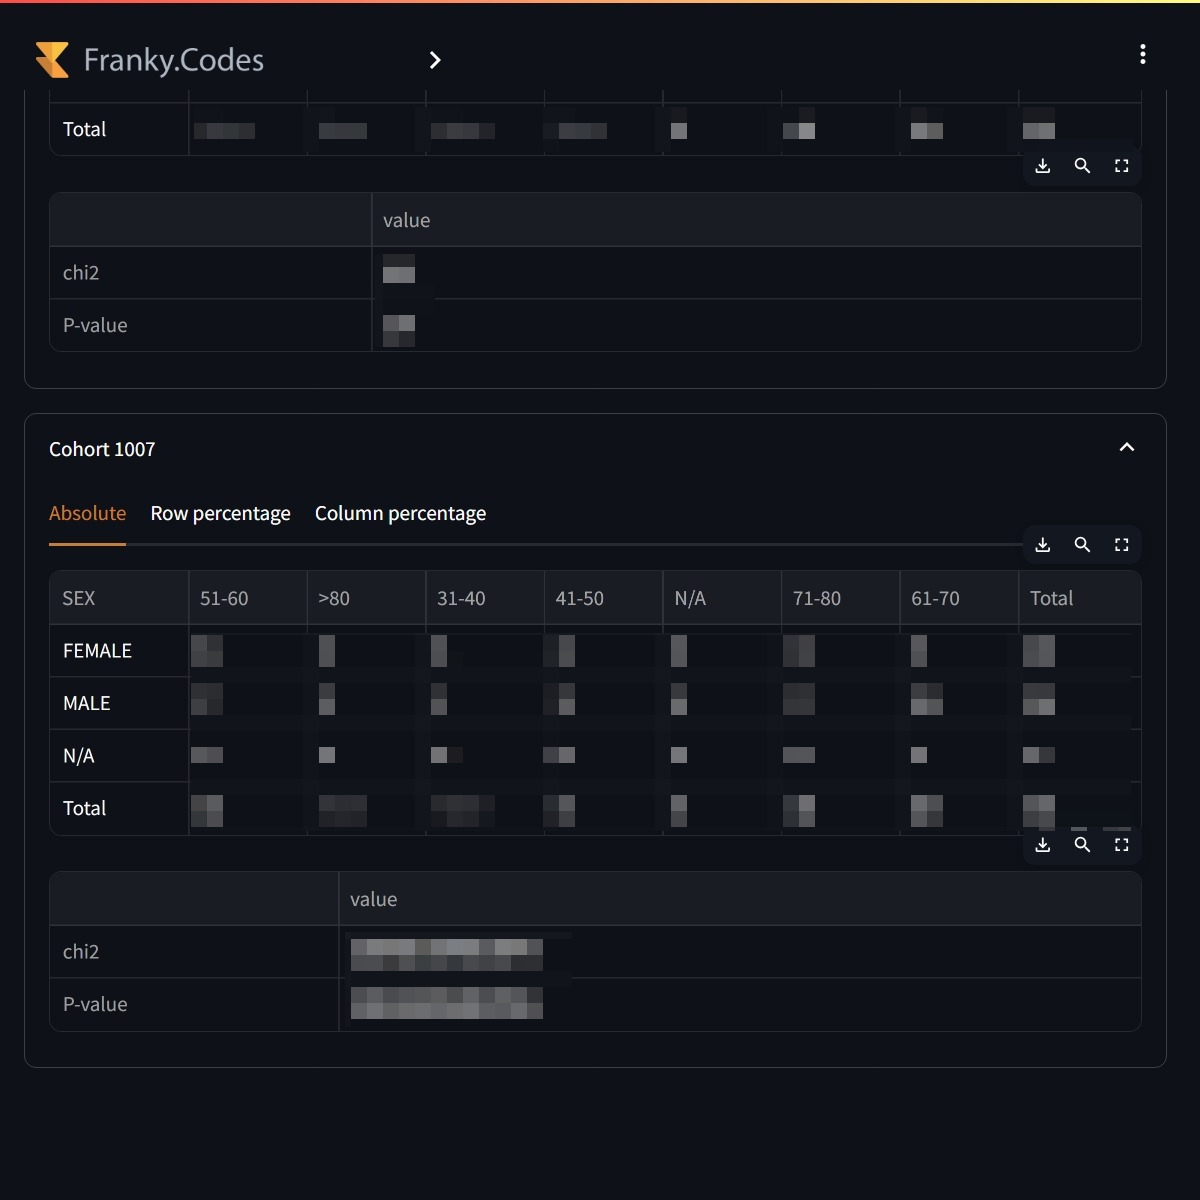
Users can compare the distribution of two variables. The crosstabulation is calculated for all selected cohorts. |
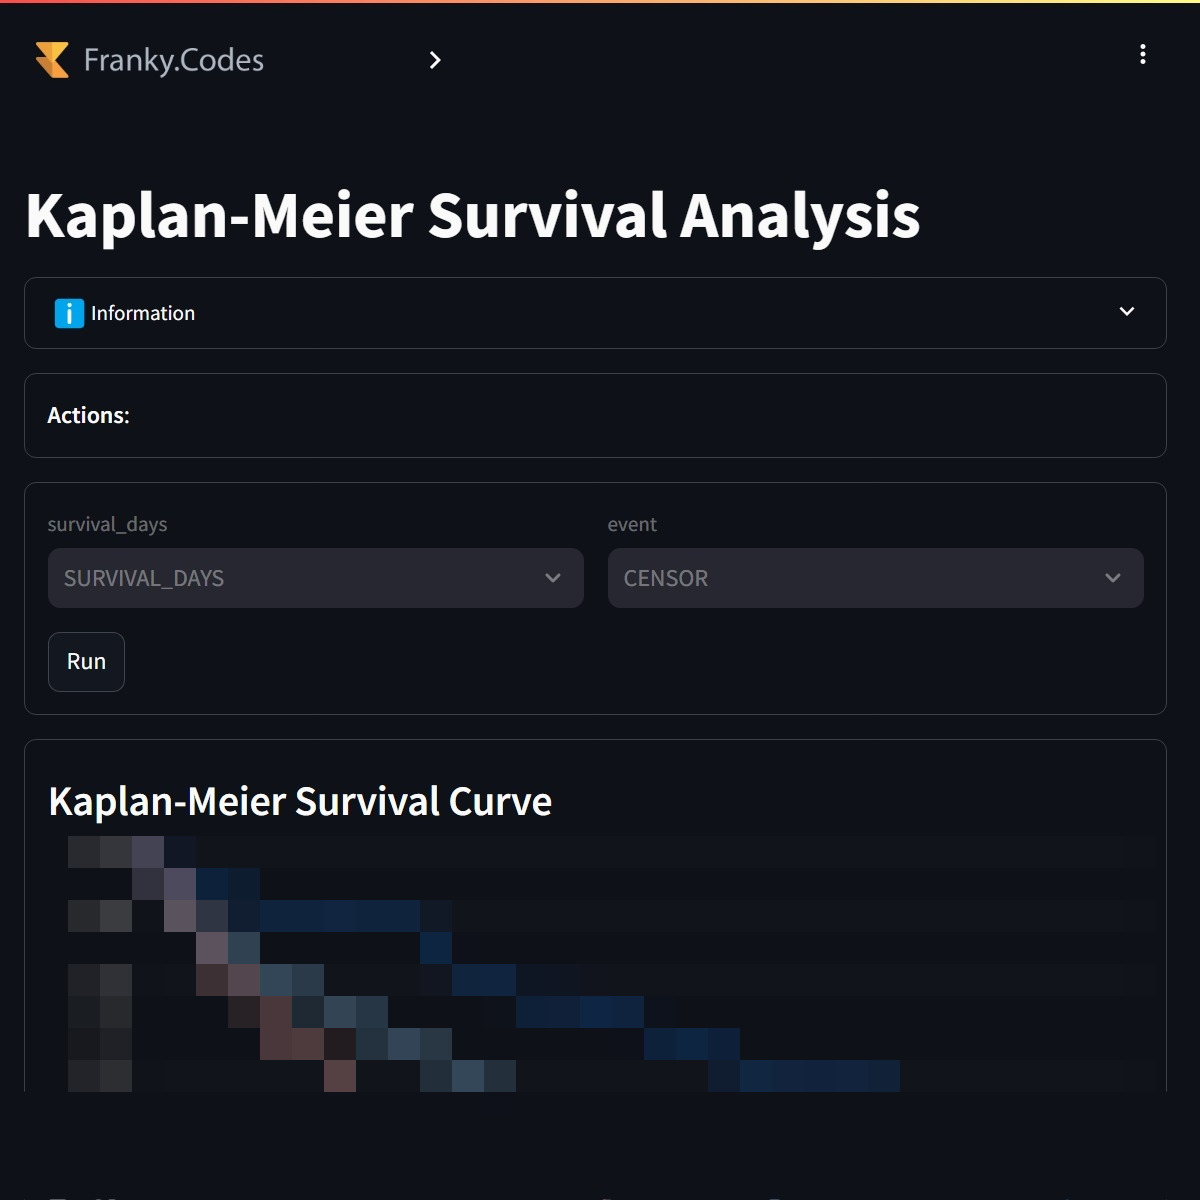
Users can compare the survival of two cohorts. The Kaplan-Meier curve is calculated for all selected cohorts. |
This project is still in development throughout 2025. There are still several features that need to be added to the system. The following features are planned:
Note
In the future the Local Data Storage will be no longer be necessary as this feature will be build into the vantage6 core (This feature is called sessions and is available from version 5+).
This might be added to the final stages of the project.